Stock Market Outlook for November 12, 2021

The Materials sector continues to make progress in record high territory a day following the inflation induced selloff.
Â
Â
Â
*** Stocks highlighted are for information purposes only and should not be considered as advice to purchase or to sell mentioned securities.  As always, the use of technical and fundamental analysis is encouraged in order to fine tune entry and exit points to average seasonal trends.
Stocks Entering Period of Seasonal Strength Today:
Subscribers – Click on the relevant link to view the full profile. Not a subscriber? Signup here.

Fastenal Co. (NASD:FAST) Seasonal Chart

Packaging Corp Of America (NYSE:PKG) Seasonal Chart
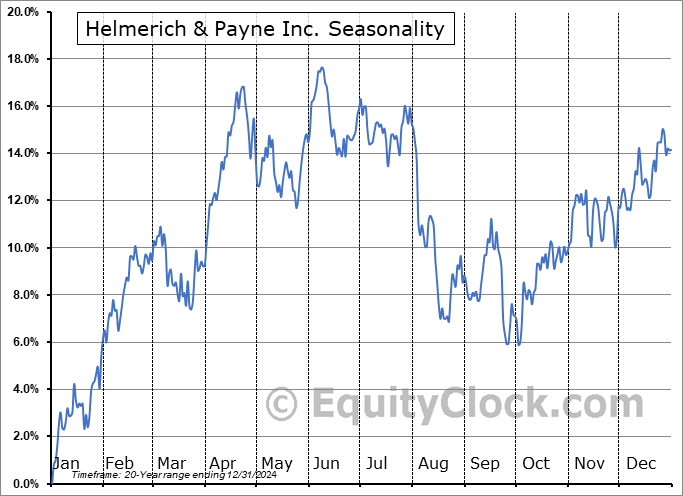
Helmerich & Payne Inc. (NYSE:HP) Seasonal Chart

Jones Lang Lasalle, Inc. (NYSE:JLL) Seasonal Chart

Terex Corp. (NYSE:TEX) Seasonal Chart

ABM Industries, Inc. (NYSE:ABM) Seasonal Chart

Ambev SA (NYSE:ABEV) Seasonal Chart

Marriott Vacations Worldwide Corp. (NYSE:VAC) Seasonal Chart

Invesco Dynamic Building & Construction ETF (NYSE:PKB) Seasonal Chart

SPDR S&P Global Dividend ETF (AMEX:WDIV) Seasonal Chart

Agilent Technologies, Inc. (NYSE:A) Seasonal Chart

CMS Energy Corp. (NYSE:CMS) Seasonal Chart

Dominion Energy, Inc. (NYSE:D) Seasonal Chart

Ensign Energy Services, Inc. (TSE:ESI.TO) Seasonal Chart

Labrador Iron Ore Royalty Corp. (TSE:LIF.TO) Seasonal Chart

SPDR S&P Emerging Markets Dividend ETF (NYSE:EDIV) Seasonal Chart

First Trust Dorsey Wright International Focus 5 ETF (NASD:IFV) Seasonal Chart

iShares U.S. Healthcare ETF (NYSE:IYH) Seasonal Chart

Aberdeen Standard Physical Palladium Shares ETF (NYSE:PALL) Seasonal Chart

iShares Global Timber & Forestry ETF (NASD:WOOD) Seasonal Chart
Â
Â
The Markets
Stocks rebounded slightly on Thursday as investors raced into materials stocks following Wednesday’s inflation induced selloff. The S&P 500 Index gained less than a then of one percent, remaining within a short-term corrective setup as the market consolidates the gains from the past five week. Support continues to be pegged at rising 20 and 50-day moving averages at 4598 and 4489, respectively. Momentum indicators have rolled over from overbought territory with RSI falling below 70 and Stochastics now sitting below 80. MACD is also on the verge of crossing below its signal line. While traditionally these bearish crossovers have provided signals to sell, the fact that these momentum indicators continue to show characteristics of a bullish trend, holding above their middle lines, our desire is to remain on course with a positive bias until definitive evidence materializes that momentum has slowed. Seasonally, the equity market is within a soft period until the week of the US Thanksgiving holiday, which is after next week. So far, the pause/digestion in the market remains part of a healthy progression of higher-highs and higher-lows.

Today, in our Market Outlook to subscribers, we discuss the following:
- The progression of the materials sector in all-time high territory
- Weekly jobless claims and the health of the labor market
- US petroleum inventories and the consolidation of the energy sector as we near the optimal holding period for the market segment
Subscribe now and we’ll send this outlook to you.
Note: If subscribed and unable to see this report in your inbox, please check your spam folder to assure that it has not been inadvertently rerouted.
Sentiment on Thursday, as gauged by the put-call ratio, ended bullish at 0.74.

Â
Â
Â
Seasonal charts of companies reporting earnings today:


Â
Â
S&P 500 Index


Â
Â
TSE Composite


| Sponsored By... |

|

