Stock Market Outlook for November 10, 2021

Real return of long-term treasury bonds at the lowest level since May of 1980, but this just bodes well for stocks as investors are pushed further out on the risk spectrum.
Â
Â
Â
*** Stocks highlighted are for information purposes only and should not be considered as advice to purchase or to sell mentioned securities.  As always, the use of technical and fundamental analysis is encouraged in order to fine tune entry and exit points to average seasonal trends.
Stocks Entering Period of Seasonal Strength Today:
Subscribers – Click on the relevant link to view the full profile. Not a subscriber? Signup here.

Goodyear Tire & Rubber Co. (NASD:GT) Seasonal Chart

Lowes Companies, Inc. (NYSE:LOW) Seasonal Chart

Texas Instruments, Inc. (NASD:TXN) Seasonal Chart
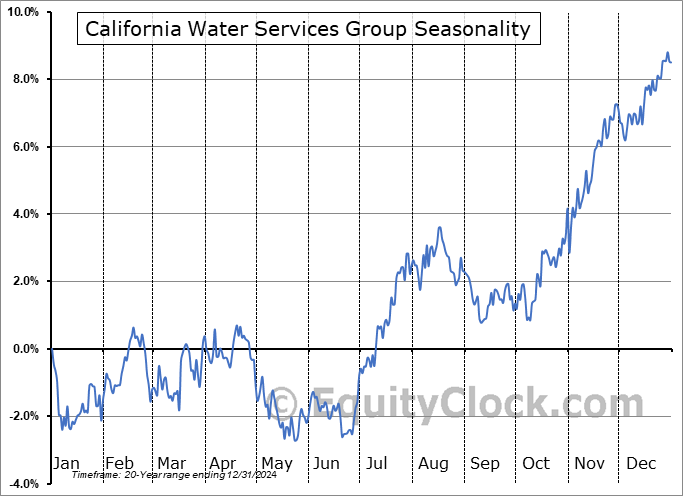
California Water Services Group (NYSE:CWT) Seasonal Chart

TreeHouse Foods Inc. (NYSE:THS) Seasonal Chart

Andersons, Inc. (NASD:ANDE) Seasonal Chart

Titan Intl, Inc. (NYSE:TWI) Seasonal Chart

Farmer Brothers Co. (NASD:FARM) Seasonal Chart

Spectrum Brands Inc. (NYSE:SPB) Seasonal Chart
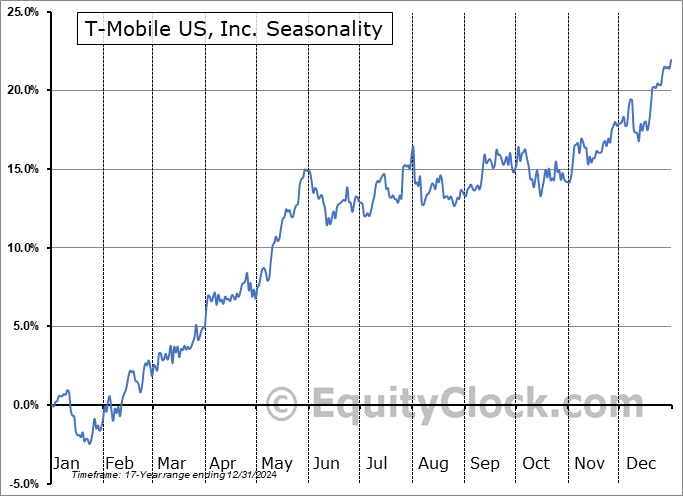
T-Mobile US, Inc. (NASD:TMUS) Seasonal Chart

NVR, Inc. (NYSE:NVR) Seasonal Chart

Lennar Corp. (NYSE:LEN/B) Seasonal Chart

WisdomTree MidCap Dividend Fund (NYSE:DON) Seasonal Chart

VanEck Vectors Mortgage REIT Income ETF (NYSE:MORT) Seasonal Chart

Invesco DWA Momentum ETF (NASD:PDP) Seasonal Chart
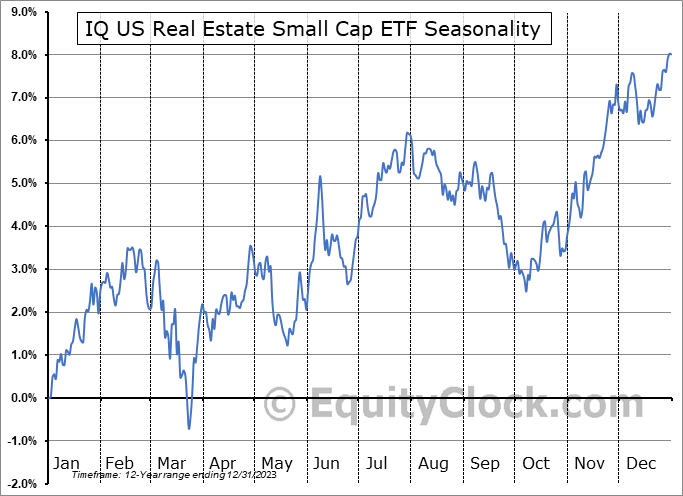
IQ US Real Estate Small Cap ETF (NYSE:ROOF) Seasonal Chart

Invesco S&P MidCap Momentum ETF (AMEX:XMMO) Seasonal Chart
Â
Â
The Markets
Stocks pulled back on Tuesday as the market starts to digest some of the gains achieved over the past five weeks. The S&P 500 Index closed down by around a third of one percent, peeling back following the test of trendline resistance in the past few sessions. Support for the large-cap benchmark can be seen at the 20 and 50-day moving averages, now at 4573 and 4484, respectively. Momentum indicators are showing signs of rolling over within overbought territory as the rising trend takes a pause. This stall/digestion has been expected as we progress through this softer period of the month ahead of the US Thanksgiving holiday in a couple of weeks from now. The trajectory on both short and intermediate-term scales continues to point higher, suggesting remaining constructive in stocks.

Today, in our Market Outlook to subscribers, we discuss the following:
- Long-term treasury bond back to resistance
- Real return for the long-term bond and what it means for stocks
- Producer Price Index
- Equity market performance during the last month and a half of post presidential election years
- Average performance of the market during mid-term election years and a breakdown of those years when a new presidential party has been elected into power
Subscribe now and we’ll send this outlook to you.
Sentiment on Tuesday, as gauged by the put-call ratio, ended bullish at 0.74.

Â
Â
Seasonal charts of companies reporting earnings today:
 Seasonal Chart")


 Seasonal Chart")

Â
Â
S&P 500 Index


Â
Â
TSE Composite


| Sponsored By... |

|

