Stock Market Outlook for November 8, 2021

Reopening plays in the market are coming back to life following the recent headlines pertaining to Pfizer’s anti viral drug.
Â
Â
Â
*** Stocks highlighted are for information purposes only and should not be considered as advice to purchase or to sell mentioned securities.  As always, the use of technical and fundamental analysis is encouraged in order to fine tune entry and exit points to average seasonal trends.
Stocks Entering Period of Seasonal Strength Today:
Subscribers – Click on the relevant link to view the full profile. Not a subscriber? Signup here.

Thermo Fisher Scientific Inc. (NYSE:TMO) Seasonal Chart

Cogeco Cable, Inc. (TSE:CCA.TO) Seasonal Chart

The J. M. Smucker Co. (NYSE:SJM) Seasonal Chart

Waste Connections, Inc. (TSE:WCN.TO) Seasonal Chart

Toyota Motor Corp. (NYSE:TM) Seasonal Chart

Ag Growth International Inc. (TSE:AFN.TO) Seasonal Chart

Enghouse Systems Ltd. (TSE:ENGH.TO) Seasonal Chart

iShares S&P Mid-Cap 400 Value ETF (NYSE:IJJ) Seasonal Chart

Global X Uranium ETF (NYSE:URA) Seasonal Chart

Health Care Select Sector SPDR Fund (NYSE:XLV) Seasonal Chart

Abercrombie & Fitch Co. (NYSE:ANF) Seasonal Chart

Teva Pharmaceutical Industries Ltd. (NYSE:TEVA) Seasonal Chart

Louisiana Pacific Corp. (NYSE:LPX) Seasonal Chart

Avid Technology, Inc. (NASD:AVID) Seasonal Chart

iShares S&P Small-Cap 600 Value ETF (NYSE:IJS) Seasonal Chart
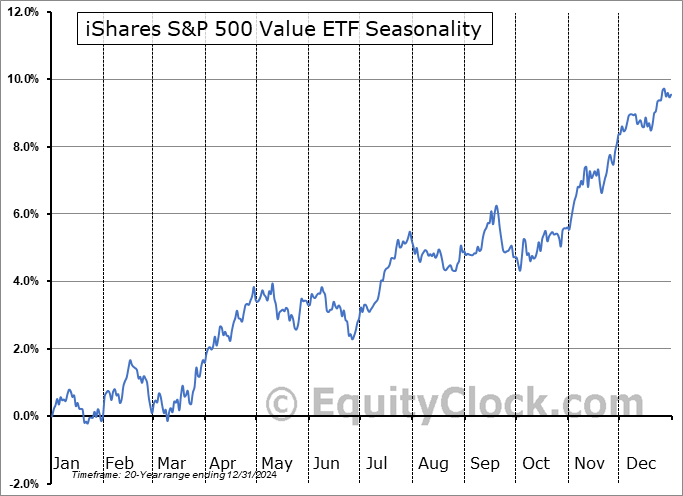
iShares S&P 500 Value ETF (NYSE:IVE) Seasonal Chart

Pacer Trendpilot US Mid Cap ETF (AMEX:PTMC) Seasonal Chart

SPDR S&P 600 Small Cap Value ETF (NYSE:SLYV) Seasonal Chart

Vanguard Small-Cap Value ETF (NYSE:VBR) Seasonal Chart

Unitedhealth Group, Inc. (NYSE:UNH) Seasonal Chart

Canadian Apartment Properties Real Estate Investment Trust (TSE:CAR/UN.TO) Seasonal Chart
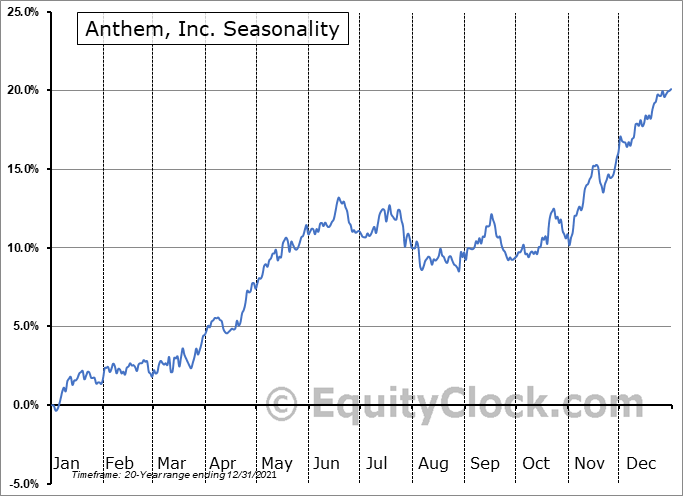
Anthem, Inc. (NYSE:ANTM) Seasonal Chart

Endo Pharmaceuticals Holdings, Inc. (NASD:ENDP) Seasonal Chart
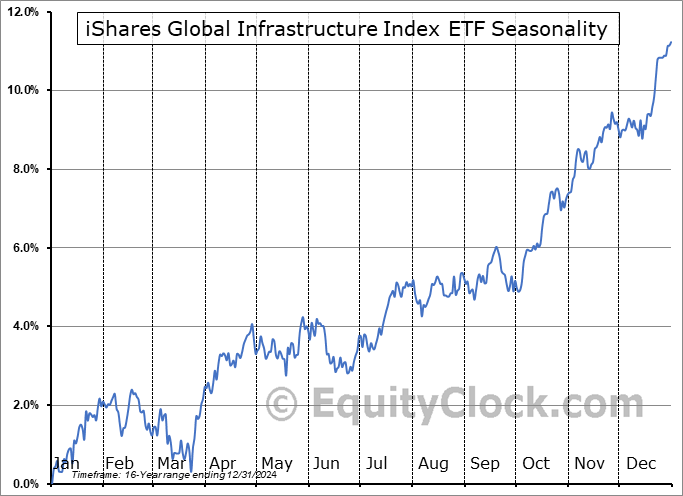
iShares Global Infrastructure Index ETF (TSE:CIF.TO) Seasonal Chart

Invesco S&P 500 Equal Weight Financials ETF (NYSE:RYF) Seasonal Chart

Invesco S&P 500 Equal Weight Health Care ETF (NYSE:RYH) Seasonal Chart
Â
The Markets
The rising trend for stocks continued on Friday as investors reacted positively to the stronger than expected increase in payrolls for the month of October.  The Bureau of Labor Statistics indicates that 531,000 payrolls were added last month, which was stronger than the consensus analyst estimate that called for a rise of 450,000. The unemployment rate improved from 4.8% to 4.6% and average hourly earnings jumped again by 0.4%, which was inline with forecasts. Stripping out the seasonal adjustments, payrolls actually increased by 1,558,000, or 1.1%, in October, which is almost double the 0.6% increase that is average for this tenth month of the year. The year-to-date change continues to hold an above average pace and is now higher by 3.9% through the first ten months of the year. The average change in payrolls through this point in the year is an increase of 0.7%. We sent out further insight to subscribers intraday, including how we’re taking advantage of the trends contained with this report. Subscribe now.

The S&P 500 Index added nearly four-tenths of one percent, reaching back to trendline resistance that the benchmark pulled back from in the month of September. The trend from the past month has started to develop a parabolic tilt, implying an unsustainable path, as momentum indicators increasingly become overbought. A check-back of rising moving averages at the 20 and 50-day moving averages remains reasonable and healthy within the context of bullish intermediate to long-term trends. Beyond the first week of November, the market tends to soften a bit, on average, providing a breather ahead of the next uptick on the seasonal timeline surrounding the US Thanksgiving holiday at the end of the month. This softer period is more of something to be aware of rather than something to trade given that it would be pure speculation to suggest when and by how much a pullback will play out. We have been and remain 100% long equities, a position we have held since the end of September.

Today, in our Market Outlook to subscribers, we discuss the following:
- Weekly look at the large-cap benchmark
- The jump in reopening plays and re-examining the two ETFs in our model with exposure to this theme
- Notable trends in October’s US Payroll report and how we are taking advantage
- Canada Labour Force Survey and what is driving activity
Subscribe now and we’ll send this outlook to you.
Sentiment on Friday, as gauged by the put-call ratio, ended bullish at 0.79.

Â
Â
Seasonal charts of companies reporting earnings today:


Â
Â
S&P 500 Index


Â
Â
TSE Composite


| Sponsored By... |

|

