Stock Market Outlook for October 27, 2021

The ratio of bonds over stocks has broken below declining trendline support that has been intact for over a decade, but the move just confirms our bias towards the latter.
Â
Â
Â
*** Stocks highlighted are for information purposes only and should not be considered as advice to purchase or to sell mentioned securities.  As always, the use of technical and fundamental analysis is encouraged in order to fine tune entry and exit points to average seasonal trends.
Stocks Entering Period of Seasonal Strength Today:
Subscribers – Click on the relevant link to view the full profile. Not a subscriber? Signup here.

Ball Corp. (NYSE:BLL) Seasonal Chart

Nucor Corp. (NYSE:NUE) Seasonal Chart

Xerox Holdings Corp. (NYSE:XRX) Seasonal Chart

IGM Financial Inc. (TSE:IGM.TO) Seasonal Chart

Gibraltar Steel Corp. (NASD:ROCK) Seasonal Chart
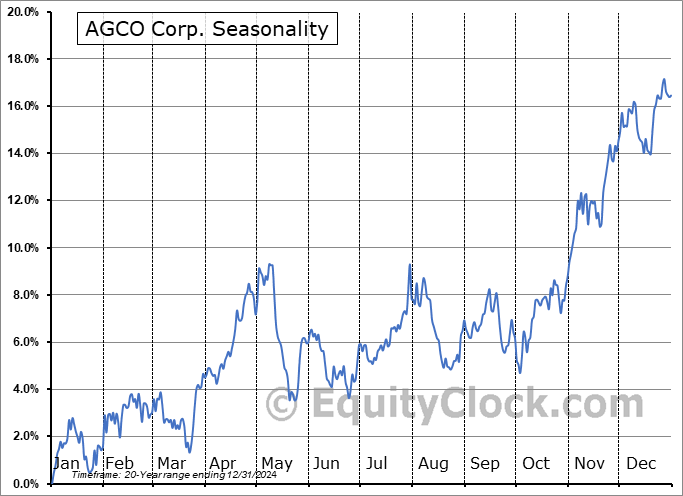
AGCO Corp. (NYSE:AGCO) Seasonal Chart

Moneta Porcupine Mines, Inc. (TSE:ME.TO) Seasonal Chart

DSP Group, Inc. (NASD:DSPG) Seasonal Chart

Century Casinos, Inc. (NASD:CNTY) Seasonal Chart

COPA Holdings SA (NYSE:CPA) Seasonal Chart

Navistar Intl Corp. (NYSE:NAV) Seasonal Chart

American Software, Inc. (NASD:AMSWA) Seasonal Chart

Central and Eastern Europe Fund, Inc. (NYSE:CEE) Seasonal Chart

VictoryShares US 500 Enhanced Volatility Wtd ETF (NASD:CFO) Seasonal Chart
Â
Â
Â
The Markets
Stocks ticked mildly higher on Tuesday, although a give-back in shares of Tesla capped the upside momentum. The S&P 500 Index added just less than two-tenths of one percent, closing at our previously proposed target for the benchmark at 4575 following the breakout of the short-term head-and-shoulders pattern a couple of weeks ago. Momentum indicators are currently sitting at the highest levels since early in the summer, but, other than stochastics, they have yet to cross the threshold that would characterize the market as being overbought. Some digestion of the gains achieved through the month of October back to levels of short and intermediate support around 20 and 50-day moving averages is still possible, but with the best six months for stocks set to begin with the month of November, the probable timing of this pause is narrowing. The period bordering October month-end is typically strong for equity markets, leaving the next probable period for pause/consolidation around the middle of November, once the enthusiasm surrounding earnings season fades. Our portfolio continues to be fully allocated to stocks (100%), an allocation enacted at the end of September, and we will continue to sit with this aggressive exposure to risk so long as the technicals and fundamentals permit through this period of strength for stocks that particularly proliferates in the final two months of the year.

Today, in our Market Outlook to subscribers, we discuss the following:
- The breakdown of bond prices relative to stocks and when the next period to become exposed to fixed income could be seen
- New Homes Sales and what is driving activity
- US Home Prices and the wealth effect
- Retail stocks
Subscribe now and we’ll send this outlook to you.
Sentiment on Tuesday, as gauged by the put-call ratio, ended bullish at 0.84.

Â
Â
Seasonal charts of companies reporting earnings today:

 Seasonal Chart")


 Seasonal Chart")


Â
Â
S&P 500 Index


Â
Â
TSE Composite


| Sponsored By... |

|

