Stock Market Outlook for October 22, 2021

Existing home sales in the US actually fell by 4.9% in September, but there was a lot to be encouraged by in the results released by the National Association of Realtors.
Â
Â
Â
*** Stocks highlighted are for information purposes only and should not be considered as advice to purchase or to sell mentioned securities.  As always, the use of technical and fundamental analysis is encouraged in order to fine tune entry and exit points to average seasonal trends.
Stocks Entering Period of Seasonal Strength Today:
Subscribers – Click on the relevant link to view the full profile. Not a subscriber? Signup here.

Eaton Corp. (NYSE:ETN) Seasonal Chart

Salesforce.com, Inc. (NYSE:CRM) Seasonal Chart

Host Hotels & Resorts Inc. (NYSE:HST) Seasonal Chart

Blackrock, Inc. (NYSE:BLK) Seasonal Chart
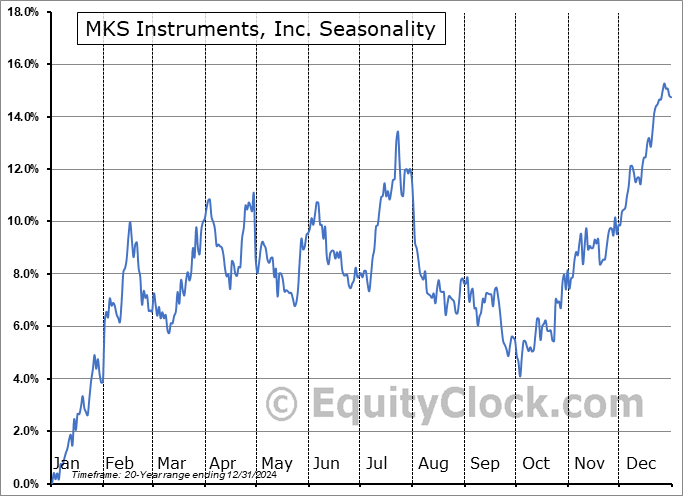
MKS Instruments, Inc. (NASD:MKSI) Seasonal Chart

Invesco S&P SmallCap Information Technology ETF (NASD:PSCT) Seasonal Chart

Invesco S&P 500 Equal Weight Technology ETF (NYSE:RYT) Seasonal Chart

First Trust Cloud Computing ETF (NASD:SKYY) Seasonal Chart

SPDR Portfolio S&P 1500 Composite Stock Market ETF (AMEX:SPTM) Seasonal Chart

Johnson Controls Intl plc (NYSE:JCI) Seasonal Chart

Reliance Steel & Aluminum (NYSE:RS) Seasonal Chart

Hanover Insurance Group, Inc. (NYSE:THG) Seasonal Chart

Buckle, Inc. (NYSE:BKE) Seasonal Chart

Badger Meter, Inc. (NYSE:BMI) Seasonal Chart

USA Truck, Inc. (NASD:USAK) Seasonal Chart

Open Text Corp. (NASD:OTEX) Seasonal Chart

Burlington Stores, Inc. (NYSE:BURL) Seasonal Chart

Vanguard S&P Mid-Cap 400 ETF (NYSE:IVOO) Seasonal Chart

Invesco S&P 500 Pure Value ETF (NYSE:RPV) Seasonal Chart

Vanguard Materials ETF (NYSE:VAW) Seasonal Chart

SPDR S&P Semiconductor ETF (NYSE:XSD) Seasonal Chart
Â
Â
The Markets
Stocks continued their relentless rise on Thursday as earnings enthusiasm keeps equity markets on an upward tilt. The S&P 500 Index tacked on an additional three-tenths of one percent after meandering around the flat-line through much of the session. The gain was enough to achieve a fresh record high as the losses that were recorded in September are completely wiped out. The benchmark is closing in on previous trendline support, which we’ll be monitoring for signs of resistance, but this is likely to not be a hurdle to be concerned of. The upside target of the short-term head-and-shoulders patterns points to 4575, which is now just 25 points above present levels. The previous neckline to the short-term bottoming pattern, as well as the 50-day moving average, around 4444 is the logical level of support beneath this market. As long as we hold above this hurdle, reason to constructive in favourable seasonal plays exist. Momentum indicators have moved back into the upper half of their ranges, characteristic of a bullish trend.

Today, in our Market Outlook to subscribers, we discuss the following:
- The pullback in copper and copper miners
- Weekly jobless claims and the health of the labor market
- Natural gas inventories and how we are playing the commodity at this point in its period of seasonal strength
- US Existing Home Sales and the stocks of the home builders
Subscribe now and we’ll send this outlook to you.
Sentiment on Thursday, as gauged by the put-call ratio, ended bullish at 0.75.

Â
Â
Seasonal charts of companies reporting earnings today:


Â
Â
S&P 500 Index


Â
Â
TSE Composite


| Sponsored By... |

|

