Stock Market Outlook for October 20, 2021

The underperformance in the defensive sectors of the market suggest that there are better places to be.
Â
Â
Â
*** Stocks highlighted are for information purposes only and should not be considered as advice to purchase or to sell mentioned securities.  As always, the use of technical and fundamental analysis is encouraged in order to fine tune entry and exit points to average seasonal trends.
Stocks Entering Period of Seasonal Strength Today:
Subscribers – Click on the relevant link to view the full profile. Not a subscriber? Signup here.
ITT Inc. (NYSE:ITT) Seasonal Chart
Rockwell Automation (NYSE:ROK) Seasonal Chart
BorgWarner, Inc. (NYSE:BWA) Seasonal Chart
Bank of Hawaii Corp. (NYSE:BOH) Seasonal Chart
Huntington Ingalls Industries Inc. (NYSE:HII) Seasonal Chart
Zebra Technologies Corp. (NASD:ZBRA) Seasonal Chart
Digi Intl Inc. (NASD:DGII) Seasonal Chart
Extreme Networks, Inc. (NASD:EXTR) Seasonal Chart
Beam Global (NASD:BEEM) Seasonal Chart
Verde Potash Plc (TSE:NPK.TO) Seasonal Chart
First Trust NASDAQ-100-Technology Sector Index Fund (NASD:QTEC) Seasonal Chart
Â
Â
The Markets
Stocks continued to advance on Tuesday as stronger than expected earnings reports gave traders reason to keep the bid behind the market alive. The S&P 500 Index gained nearly three-quarters of one percent, continuing to move past resistance at the 50-day moving average and closing in on the all-time high that was charted early in September around 4545. As has been highlighted in previous reports, the upside target of a short-term head-and-shoulders that the benchmark broke above last week is toward 4575, now around 55-points from present levels. The benchmark has quickly moved past the strains that burdened it through the end of the third quarter amidst the month-end/quarter-end rebalance/reset, which is benefitting our fully invested allocation to stocks that was enacted at the end of September. So far, so good, but as we near another month-end, we have to be prepared for an alleviation of the pace of the rapid rebound and expect some moderation. We will sit with our current allocation through this period and wait for another momentum burst into the month of November when the best six months for stocks officially gets underway.
Today, in our Market Outlook to subscribers, we discuss the following:
- Indications of breadth on the rise
- Treasury yields reaching back towards the highs of the year and the range that is likely to act as a burden on economic and equity market momentum
- The underperformance of defensive sectors of the market
- US Housing Starts and what is driving activity
- Homebuilding stocks and our scrutiny of the allocation to this seasonal bet
Subscribe now and we’ll send this outlook to you.
Sentiment on Tuesday, as gauged by the put-call ratio, ended bullish at 0.76.Â
Â
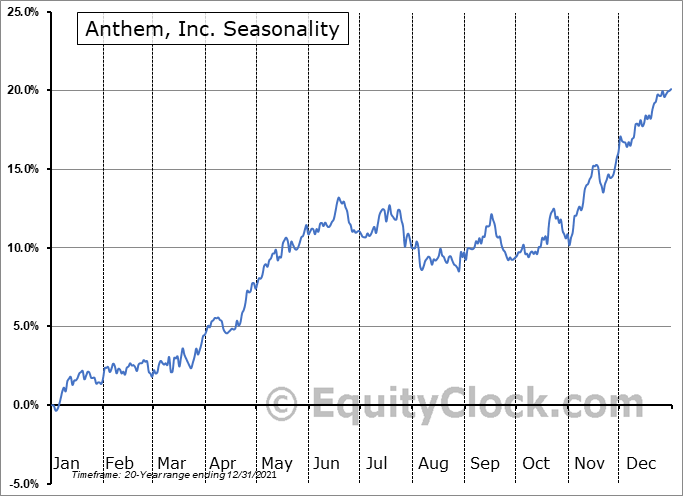
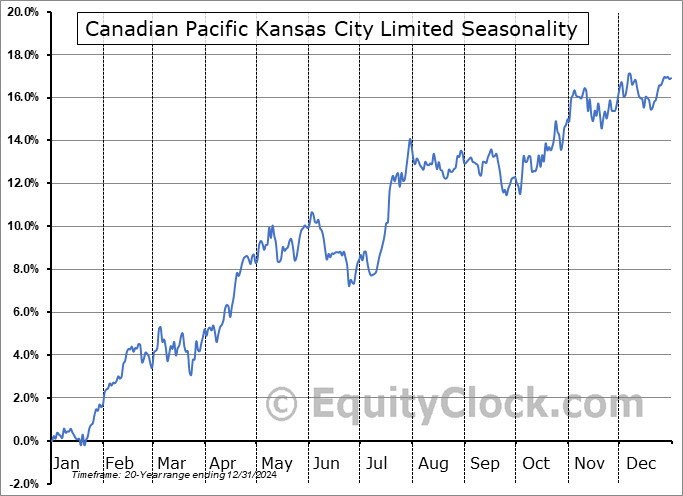
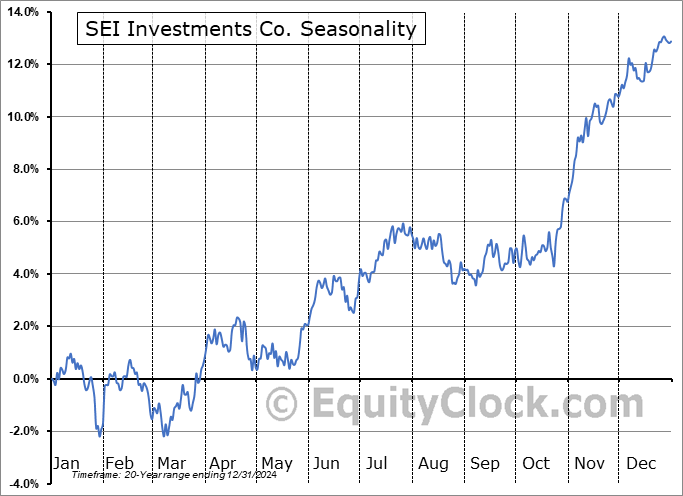
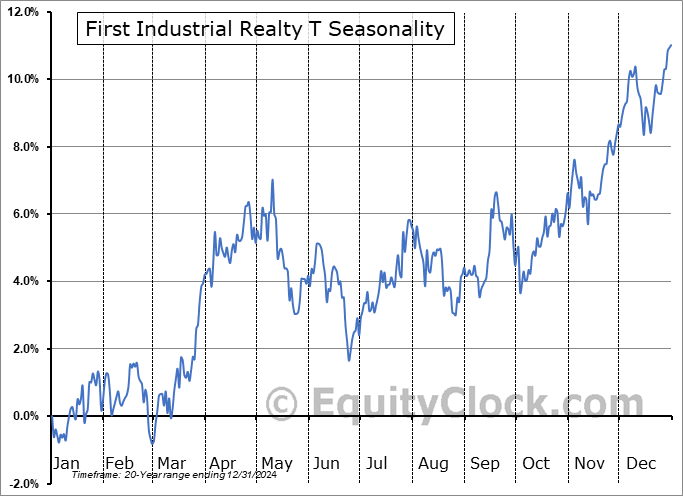
Seasonal charts of companies reporting earnings today:
Â
Â
S&P 500 Index
Â
Â
TSE Composite
| Sponsored By... |

|


