Stock Market Outlook for October 12, 2021

While the change in employment for September was merely average, the areas of strength are confirming our bias of where we should be investing this fall.
Â
Â
*** Stocks highlighted are for information purposes only and should not be considered as advice to purchase or to sell mentioned securities.  As always, the use of technical and fundamental analysis is encouraged in order to fine tune entry and exit points to average seasonal trends.
Stocks Entering Period of Seasonal Strength Today:
Subscribers – Click on the relevant link to view the full profile. Not a subscriber? Signup here.
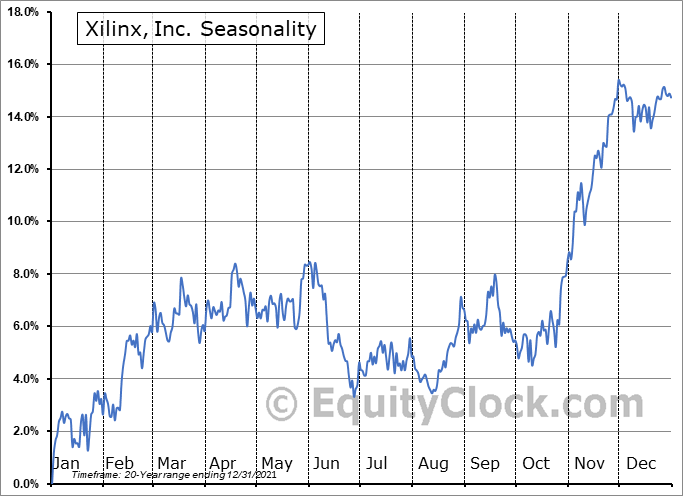
Xilinx, Inc. (NASD:XLNX) Seasonal Chart

Morgan Stanley (NYSE:MS) Seasonal Chart

PACCAR, Inc. (NASD:PCAR) Seasonal Chart

USX-US Steel Group, Inc. (NYSE:X) Seasonal Chart
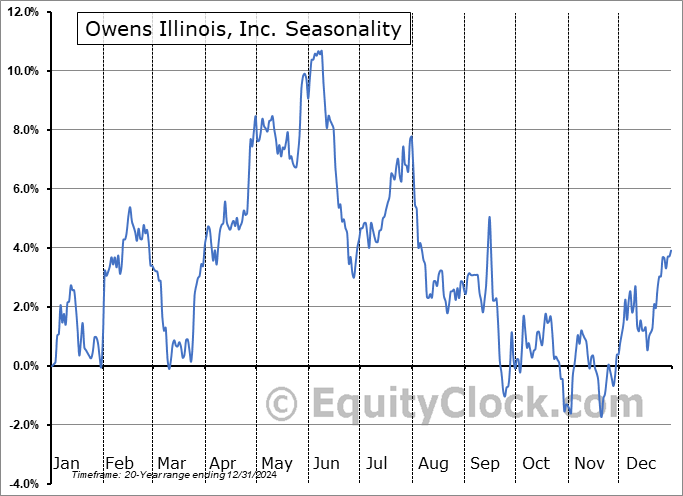
Owens Illinois, Inc. (NYSE:OI) Seasonal Chart

ASML Holding NV (NASD:ASML) Seasonal Chart

Maxar Technologies Ltd. (TSE:MAXR.TO) Seasonal Chart

Vanguard S&P Mid-Cap 400 Growth ETF (NYSE:IVOG) Seasonal Chart

Direxion Daily Semiconductor Bull 3x Shares (NYSE:SOXL) Seasonal Chart

ManpowerGroup (NYSE:MAN) Seasonal Chart

Cracker Barrel Old Country Store, Inc. (NASD:CBRL) Seasonal Chart

Chemed Corp. (NYSE:CHE) Seasonal Chart
Â
Note: Due to the Thanksgiving Holiday in Canada on Monday, our next report will be released on Tuesday.
Â
The Markets
Stocks drifted slightly lower on Friday following a weaker than expected read on employment for the month of September. The Bureau of Labor Statistics indicates that 194,000 payrolls were added last month, which was much weaker than consensus analyst estimate that called for a rise of 475,000. The unemployment rate improved from 5.2% to 4.8% and average hourly earnings jumped again by 0.6%, which is stronger than the 0.4% increase that was forecasted. Stripping out the seasonal adjustments, payrolls actually increased by 654,000, or 0.4%, in September, which matches the average change for this ninth month of the year. The year-to-date change continues to hold an above average pace and is now higher by 2.8% through the first three-quarters of the year. The average change in payrolls through this point in the year is an increase of 0.2%. We sent out further insight to subscribers intraday on Friday. Subscribe now.

The S&P 500 Index closed lower by just less than two-tenths of one percent following the report, remaining pinned to levels around the 20-day moving average. Resistance continues to pegged around the 50-day moving average, now at 4438. Despite the loss on the day, MACD still managed to cross above its signal line in what is a renewed buy signal. Both RSI and MACD remain below their middle lines, which is characteristic of a market within a bearish trend. Third quarter earnings season kicks off in the week ahead, providing traders with a catalyst to react to as we progress into the best six months for stocks between November and April.

Today, in our Market Outlook to subscribers, we discuss the following:
- Weekly look at the large-cap benchmark
- Insights on the areas of strength in September’s employment report and how to play them in investment portfolios
- The strongest year-to-date change for wages since 1981 and how the bond market is reacting
- Canadian Labour Force Survey and what is driving activity
Subscribe now and we’ll send this outlook to you.
Sentiment on Friday, as gauged by the put-call ratio, ended bearish at 1.04.

Â
Seasonal charts of companies reporting earnings today:


Â
Â
S&P 500 Index


Â
TSE Composite


| Sponsored By... |

|

