Stock Market Outlook for October 6, 2021

Treasury bond ETFs closing below their 200-day moving averages as investors turn back towards risk with stocks.
Â
Â
Â
*** Stocks highlighted are for information purposes only and should not be considered as advice to purchase or to sell mentioned securities.  As always, the use of technical and fundamental analysis is encouraged in order to fine tune entry and exit points to average seasonal trends.
Stocks Entering Period of Seasonal Strength Today:
Subscribers – Click on the relevant link to view the full profile. Not a subscriber? Signup here.
Deutsche X-trackers MSCI Germany Hedged Equity ETF (AMEX:DBGR) Seasonal Chart
Perkinelmer, Inc. (NYSE:PKI) Seasonal Chart
PHX Energy Services Corp. (TSE:PHX.TO) Seasonal Chart
Eagle Bancorp, Inc. (NASD:EGBN) Seasonal Chart
Hudson Pacific Properties Inc. (NYSE:HPP) Seasonal Chart
AudioCodes Ltd. (NASD:AUDC) Seasonal Chart
Whitestone REIT (NYSE:WSR) Seasonal Chart
Spirit Airlines, Inc. (NYSE:SAVE) Seasonal Chart
Headwater Exploration Inc. (TSE:HWX.TO) Seasonal Chart
VanEck Vectors Agribusiness ETF (NYSE:MOO) Seasonal Chart
Â
Â
The Markets
Stocks snapped back from Monday’s losses in typical turnaround Tuesday fashion. The S&P 500 Index gained 1.05%, moving back to its 100-day moving average that the benchmark has been gyrating around for the past few sessions. The benchmark is showing signs of concluding a short-term ABC corrective pattern as momentum indicators start to show signs of bottoming. Resistance can still be pegged around 20 and 50-day moving averages overhead, as well as the lower-limit of the rising 200-point trend channel that was broken in the back half of September.
Today, in our Market Outlook to subscribers, we discuss the following:
- The pending buy signal for stocks according to our 12-21 strategy
- Market far off from excessive complacency
- The breakdown of treasury bond prices
- US Vehicle Sales and what the trends are saying
- Automobile industry stocks
- Retail industry stocks
Subscribe now and we’ll send this outlook to you.
Subscribed, but not receiving our subscriber exclusive content to your inbox? Please check your bulk/spam folder to assure that our distributions have not been inadvertently diverted. Still not receiving our stuff? Reach out to us via our Help form and we’ll be happy to assist you. Often, the easiest fix to circumvent punitive spam filters is to just use an alternate email address with another provider. Email addresses can be changed in the Members Section at https://charts.equityclock.com/members
Sentiment on Tuesday, as gauged by the put-call ratio, ended bullish at 0.86.
Â
Â
Â
Â
Â
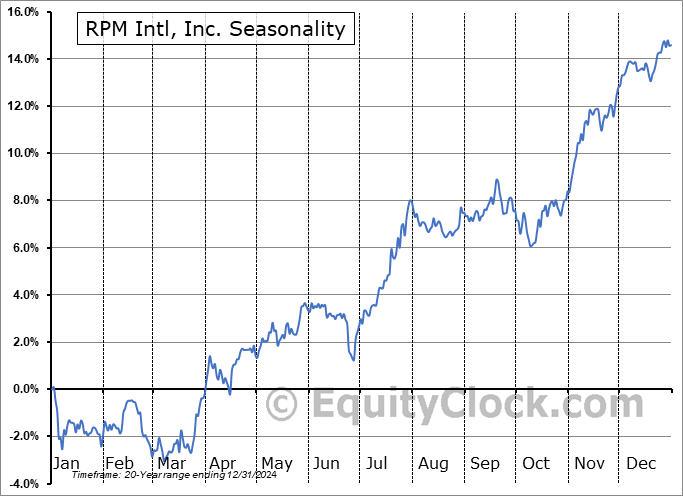
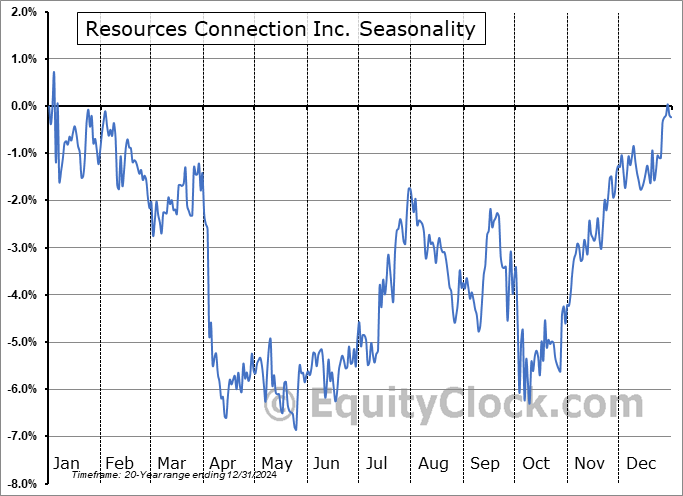
Seasonal charts of companies reporting earnings today:
Â
Â
S&P 500 Index
Â
Â
TSE Composite
| Sponsored By... |

|


