Stock Market Outlook for October 1, 2021

The S&P 500 Index has averaged a gain of 1.1% in the month of October as it rebounds from the weakest, most volatile month of the year.
Â
Â
Â
*** Stocks highlighted are for information purposes only and should not be considered as advice to purchase or to sell mentioned securities.  As always, the use of technical and fundamental analysis is encouraged in order to fine tune entry and exit points to average seasonal trends.
Stocks Entering Period of Seasonal Strength Today:
Subscribers – Click on the relevant link to view the full profile. Not a subscriber? Signup here.

Oshkosh Corp. (NYSE:OSK) Seasonal Chart

Boralex, Inc. (TSE:BLX.TO) Seasonal Chart

Heidrick & Struggles Intl, Inc. (NASD:HSII) Seasonal Chart

Kirkland’s, Inc. (NASD:KIRK) Seasonal Chart

Hovnanian Enterprises, Inc. (NYSE:HOV) Seasonal Chart

YPF Sociedad Anonima (NYSE:YPF) Seasonal Chart

L.B. Foster Co. (NASD:FSTR) Seasonal Chart

NLIndustries, Inc. (NYSE:NL) Seasonal Chart

Lawson Products, Inc. (NASD:LAWS) Seasonal Chart

Vicor Corp. (NASD:VICR) Seasonal Chart
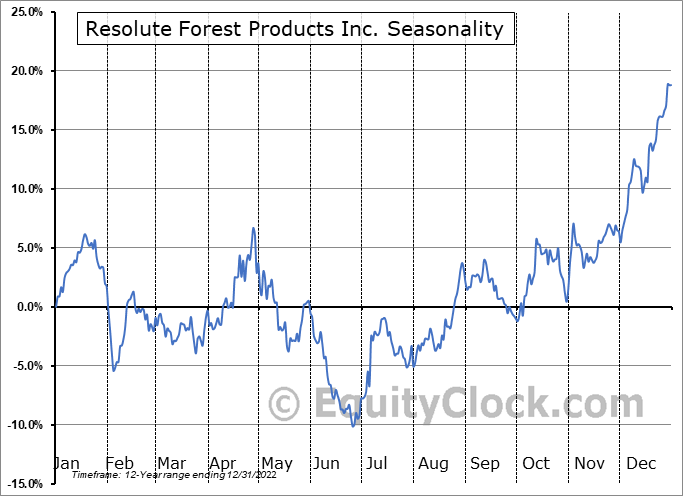
Resolute Forest Products Inc. (TSE:RFP.TO) Seasonal Chart

Vanguard S&P 500 Index ETF (CAD-hedged) (TSE:VSP.TO) Seasonal Chart

iShares S&P/TSX Global Base Metals Index ETF (TSE:XBM.TO) Seasonal Chart

Direxion Daily Small Cap Bull 3x Shares (NYSE:TNA) Seasonal Chart

Deere & Co. (NYSE:DE) Seasonal Chart

3M Co. (NYSE:MMM) Seasonal Chart

Robert Half Intl, Inc. (NYSE:RHI) Seasonal Chart

Roper Technologies, Inc. (NYSE:ROP) Seasonal Chart

Companhia Brasileira de Distribuicao, SA (NYSE:CBD) Seasonal Chart

iShares U.S. Insurance ETF (NYSE:IAK) Seasonal Chart

BMO Equal Weight U.S. Banks Index ETF (TSE:ZBK.TO) Seasonal Chart

First Trust Nasdaq-100 Equal Weighted Index Fund (NASD:QQEW) Seasonal Chart
Â
Â
The Markets
Traders were selling stocks again on Thursday as portfolio managers close the books on the month and the quarter. The S&P 500 Index shed 1.19%, cracking below support at the 100-day moving average and moving back to the low recorded a week and a half ago on September 20th. Resistance at former trend channel support, now around 4500, has been confirmed as momentum indicators start to show characteristics of a bearish trend for the first time since the winter of 2020 amidst the pandemic declines. MACD and RSI have found spots below their middle lines as the bulls take a breather.

Today, in our Market Outlook to subscribers, we discuss the following:
- A look at the monthly chart and performance of the large-cap benchmark
- The average tendency for the S&P 500 Index in the month of October and the strategy to re-accumulate equity exposure for the period of seasonal strength for stocks
- The change in margin debt in investment accounts through the end of August
- Weekly Jobless Claims
- Natural gas inventories and the exposure to the commodity that you should pursue now
Subscribe now and we’ll send this outlook to you.
For the month ahead, the large-cap benchmark has typically recovered from the September drawdown by gaining 1.1%, on average, in October over the past two decades with 65% of periods closing higher.Â


Just released…
Our 118-page monthly report has just been distributed to subscribers, providing insight on everything you need to know from seasonal, technical, and fundamental perspectives through the month(s) ahead.Â
Highlights in this report include:
- Equity market tendencies in the month of October
- High yield spreads have stopped going down
- Bond Prices and the conclusion to the period of seasonal strength
- Economic beats becoming fewer
- Evidence that the fourth wave of COVID took a toll on activity at the end of summer
- Waning strength of the consumer ahead of the holiday season
- Semiconductors
- Weak Existing Home Sales
- Tracking the spread of COVID
- The rebirth of reopening plays in the market
- Bullish sentiment being washed out
- Shipping demand remaining strong into the prime end of year spending season
- The strength of the manufacturing economy
- Manufacturers upbeat about their prospects through the months ahead
- US Dollar
- Period of seasonal strength for Natural Gas
- The desired exposure to the energy sector
- Market Breadth and the sustainability of the strength in the market
- The technical status of the S&P 500 Index
- Positioning for the months ahead
- Sector reviews and ratings
- Stocks that have frequently gained in the month of October
- Notable stocks and ETFs entering their period of strength in October
Subscribe now and we’ll send this and other insights directly to you inbox on a regular basis.
With the new month now upon us and as we celebrate the release of our monthly report for October, today we release our screen of all of the stocks that have gained in every October over their trading history. While we at Equity Clock focus on a three-pronged approach (seasonal, technical, and fundamental analysis) to gain exposure to areas of the market that typically perform well over intermediate (2 to 6 months) timeframes, we know that stocks that have a 100% frequency of success for a particular month is generally of interest to those pursuing a seasonal investment strategy. Below are the results:

And how about those securities that have never gained in this tenth month of the year, here they are:

*Note: None of the results highlighted above have the 20 years of data that we like to see in order to accurately gauge the annual recurring, seasonal influences impacting an investment, therefore the reliability of the results should be questioned. We present the above list as an example of how our downloadable spreadsheet available to yearly subscribers can be filtered.
Sentiment on Thursday, as gauged by the put-call ratio, ended bearish at 1.07.

Â
Â
Â
Seasonal charts of companies reporting earnings today:
- No significant earnings reports scheduled
Â
Â
S&P 500 Index


Â
Â
TSE Composite


| Sponsored By... |

|

