Stock Market Outlook for September 20, 2021

Everything that we desire to buy is going on sale.
Â
Â
Â
*** Stocks highlighted are for information purposes only and should not be considered as advice to purchase or to sell mentioned securities.  As always, the use of technical and fundamental analysis is encouraged in order to fine tune entry and exit points to average seasonal trends.
Stocks Entering Period of Seasonal Strength Today:
Subscribers – Click on the relevant link to view the full profile. Not a subscriber? Signup here.

Autodesk, Inc. (NASD:ADSK) Seasonal Chart

Northfield Bancorp, Inc. (NASD:NFBK) Seasonal Chart

Power Integrations, Inc. (NASD:POWI) Seasonal Chart

Dolby Laboratories (NYSE:DLB) Seasonal Chart

TFS Financial Corp. (NASD:TFSL) Seasonal Chart

WidePoint Corp. (AMEX:WYY) Seasonal Chart

1st Constitution Bancorp (NASD:FCCY) Seasonal Chart
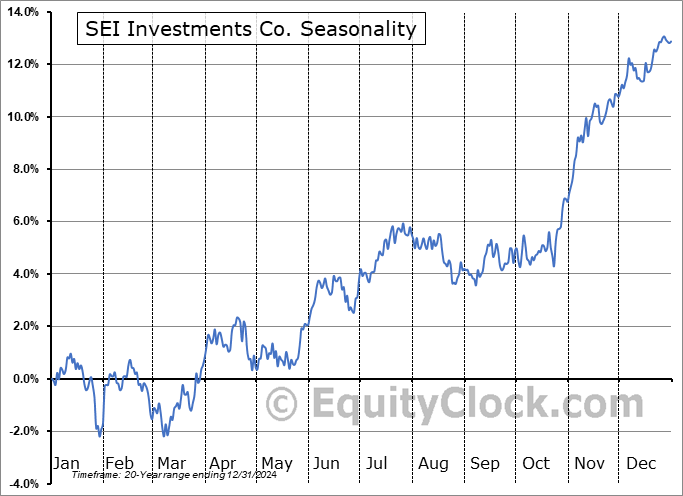
SEI Investments Co. (NASD:SEIC) Seasonal Chart

Industrial-Alliance Life Insurance Co. (TSE:IAG.TO) Seasonal Chart

Park Lawn Corp. (TSE:PLC.TO) Seasonal Chart
Â
Â
The Markets
Stocks dipped on Friday as the typical September weakness drags on equity benchmarks ahead of the end of the third quarter. The S&P 500 Index shed just over nine-tenths of one percent, ending marginally below its 50-day moving average, a widely followed hurdle to the intermediate trend. Resistance at the 20-day moving average has been confirmed following the rejection from this hurdle in recent sessions. The decline pokes a hole in the rising 200-point trading range that has defined the limits of the rising intermediate-term trend all year and momentum indicators are relinquishing their characteristics of a bullish trend. Refer to our last Market Outlook (for September 17th) for levels of downside risk in the large-cap benchmark.

Today, in our Market Outlook for subscribers, we discuss the following:
- Weekly look at the large-cap benchmark
- Shipping activity: What it has to say about the strength of demand for products in the economy and how to gain exposure this fall
Subscribe now and we’ll send this outlook to you.
Sentiment on Friday, as gauged by the put-call ratio, ended slightly bullish at 0.92.

Â
Â
Â
Â
Seasonal charts of companies reporting earnings today:

Â
Â
S&P 500 Index


Â
Â
TSE Composite


| Sponsored By... |

|

