Stock Market Outlook for September 2, 2021

Economic data continues to miss expectations, resulting in the ongoing plunge in the Economic Surprise Index.
Â
Â
Â
*** Stocks highlighted are for information purposes only and should not be considered as advice to purchase or to sell mentioned securities.  As always, the use of technical and fundamental analysis is encouraged in order to fine tune entry and exit points to average seasonal trends.
Stocks Entering Period of Seasonal Strength Today:
Subscribers – Click on the relevant link to view the full profile. Not a subscriber? Signup here.

Telefonica SA (NYSE:TEF) Seasonal Chart

Exxon Mobil Corp. (NYSE:XOM) Seasonal Chart

Eaton Vance Corp. (NYSE:EV) Seasonal Chart

Monro, Inc. (NASD:MNRO) Seasonal Chart

CNO Financial Group Inc. (NYSE:CNO) Seasonal Chart

China Distance Education Holdings Ltd. (NYSE:DL) Seasonal Chart

Murphy USA Inc. (NYSE:MUSA) Seasonal Chart

Great Western Bancorp Inc. (NYSE:GWB) Seasonal Chart
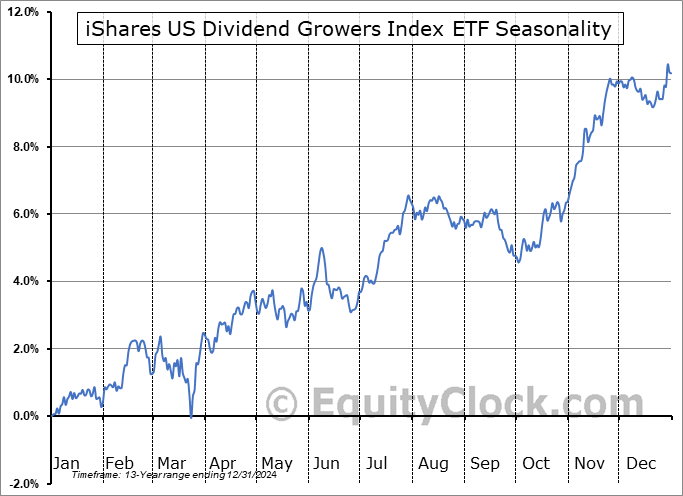
iShares US Dividend Growers Index ETF (CAD-Hedged) (TSE:CUD.TO) Seasonal Chart

First Asset Energy Giants Covered Call ETF (CAD Hedged) (TSE:NXF.TO) Seasonal Chart

iShares U.S. High Dividend Equity Index ETF (CAD-Hedged) (TSE:XHD.TO) Seasonal Chart

BMO US High Dividend Covered Call ETF (TSE:ZWH.TO) Seasonal Chart

WisdomTree SmallCap Dividend Fund (NYSE:DES) Seasonal Chart

WisdomTree Total Dividend Fund (NYSE:DTD) Seasonal Chart

Schwab Fundamental U.S. Large Company Index ETF (AMEX:FNDX) Seasonal Chart

Cambria Global Value ETF (AMEX:GVAL) Seasonal Chart

Invesco KBW Regional Banking ETF (NASD:KBWR) Seasonal Chart

SPDR S&P Regional Banking ETF (NYSE:KRE) Seasonal Chart

Vanguard Mega Cap Value ETF (NYSE:MGV) Seasonal Chart

Oppenheimer Ultra Dividend Revenue ETF (AMEX:RDIV) Seasonal Chart

Vanguard S&P 500 Value ETF (NYSE:VOOV) Seasonal Chart
Â
Â
The Markets
Stocks closed mixed on the first trading session of September as the market digested a weaker than expected read of payroll growth for the month of August. ADP indicates that 374,000 payrolls were added in August, far short of the 500,000 increase that was expected. The S&P 500 Index ended close to the unchanged mark on the day, higher by a mere 0.03%. Struggle around the mid-point to the approximately 200-point rising trading range that spans between 4400 and 4600 continues to be apparent.Â

Today, in our Market Outlook to subscribers, we discuss the following:
- Economic data increasingly missing expectations
- US petroleum inventories and our opportunity in the energy sector through the end of the year
- The price of oil
- US Construction Spending and the period of seasonal weakness for construction stocks ahead
Subscribe now and we’ll send this outlook to you.
Just Released…
Our monthly report for September is out and it’s a long one. At 116 pages, this is our largest report yet.
Highlights in this report include:
- Equity market tendencies in the month of September
- Price of Copper hinting of the cooling of the growth in the economy
- The decline in the price of oil
- The currency impact: US and Canadian Dollars
- The seasonal trade in Natural Gas
- The willingness of consumers to spend
- The Retail Industry
- Consumer sentiment
- Bond market regaining levels of long-term support
- Emerging markets
- Strong demand for vehicles, look towards these stocks
- The encouraging signal that suggests homebuilders are moving past supply chain backlogs that burdened them this spring
- The strength of industrial production
- How are the manufacturers feeling about their prospects ahead?
- Shipping demand and the period of seasonal strength for the transportation sector
- Investment services: A hedge against volatility?
- Seasonal play in agriculture stocks
- The second of the weakest two-week spans in the equity market
- The technical status of the S&P 500 Index
- What the technical indicators are saying about breadth
- Positioning for the months ahead
- Sector reviews and ratings
- Stocks that have frequently gained in the month of September
- Notable stocks and ETFs entering their period of strength in September
Subscribe now and we’ll send this report directly to your inbox.
Sentiment on Wednesday, as gauged by the put-call ratio, ended bullish at 0.81.

Â
Â
Seasonal charts of companies reporting earnings today:


 Seasonal Chart")


Â
Â
S&P 500 Index


Â
Â
TSE Composite


| Sponsored By... |

|

