Stock Market Outlook for August 26, 2021

While the VIX continues to show a trend of lower-highs, seasonal tendencies suggest that we should expect higher values before the quarter is complete.
Â
Â
Â
*** Stocks highlighted are for information purposes only and should not be considered as advice to purchase or to sell mentioned securities.  As always, the use of technical and fundamental analysis is encouraged in order to fine tune entry and exit points to average seasonal trends.
Stocks Entering Period of Seasonal Strength Today:
Subscribers – Click on the relevant link to view the full profile. Not a subscriber? Signup here.

FedEx Corp. (NYSE:FDX) Seasonal Chart

Vodafone Group Public Limited Company (NASD:VOD) Seasonal Chart

East West Bancorp, Inc. (NASD:EWBC) Seasonal Chart
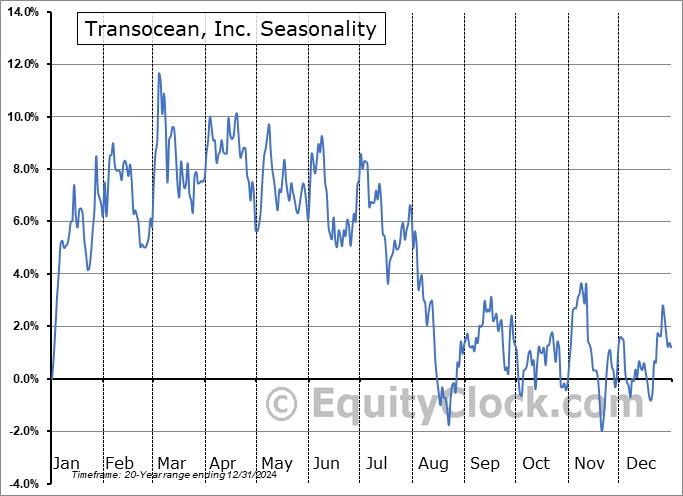
Transocean, Inc. (NYSE:RIG) Seasonal Chart

Sterling Construction Co. Inc. (NASD:STRL) Seasonal Chart
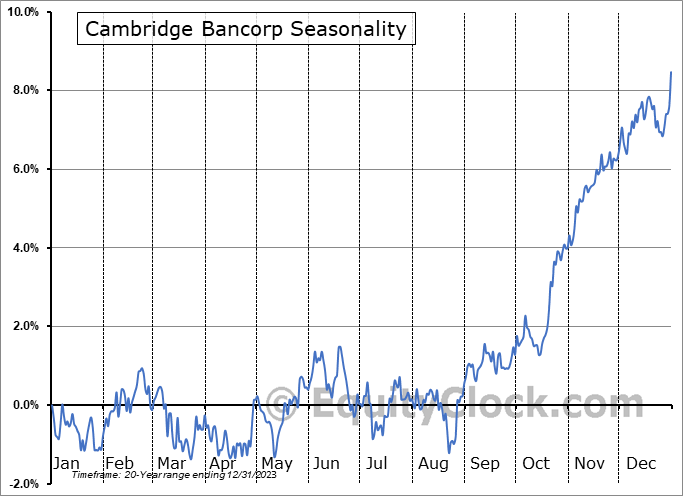
Cambridge Bancorp (NASD:CATC) Seasonal Chart

iShares Russell Top 200 Value ETF (NYSE:IWX) Seasonal Chart

Schwab US Dividend Equity ETF (AMEX:SCHD) Seasonal Chart

Vanguard Russell 1000 Value ETF (NASD:VONV) Seasonal Chart
Â
Â
The Markets
Stocks drifted higher on Wednesday with the S&P 500 Index once again punching out a record high. The large-cap benchmark gained just over two-tenths of one percent, continuing to pressure the mid-point to the rising 200-point trading range that can be seen between 4375 and 4575. MACD has crossed back above its signal line, however, the trend of the momentum indicator has noticeably flat-lined in the past couple of months as enthusiasm towards stocks wanes at these heights. Major moving averages continue to point higher, expressing positive trends across multiple timescales.

Today, in our Market Outlook to subscribers, we discuss the following:
- The Volatility Index
- Last week’s look at petroleum inventories in the US and our opportunity to gain exposure to a certain segment of the energy sector
- US Durable Goods Orders
Subscribe now and we’ll send this outlook to you.
Sentiment on Wednesday, as gauged by the put-call ratio, ended bullish at 0.80.

Â
Â
Â
Seasonal charts of companies reporting earnings today:
 Seasonal Chart")


 Seasonal Chart")
 Seasonal Chart")


Â
Â
S&P 500 Index


Â
Â
TSE Composite


| Sponsored By... |

|

