Stock Market Outlook for August 20, 2021

The breakout in the US Dollar Index above a double-bottom pattern is seen threatening risk assets.
Â
Â
Â
*** Stocks highlighted are for information purposes only and should not be considered as advice to purchase or to sell mentioned securities.  As always, the use of technical and fundamental analysis is encouraged in order to fine tune entry and exit points to average seasonal trends.
Stocks Entering Period of Seasonal Strength Today:
Subscribers – Click on the relevant link to view the full profile. Not a subscriber? Signup here.

Meredith Corp. (NYSE:MDP) Seasonal Chart

NetApp Inc. (NASD:NTAP) Seasonal Chart

Banco Santander SA (NYSE:SAN) Seasonal Chart

Raymond James Financial Inc. (NYSE:RJF) Seasonal Chart

Sienna Senior Living Inc. (TSE:SIA.TO) Seasonal Chart

Kennametal, Inc. (NYSE:KMT) Seasonal Chart

PTC, Inc. (NASD:PTC) Seasonal Chart
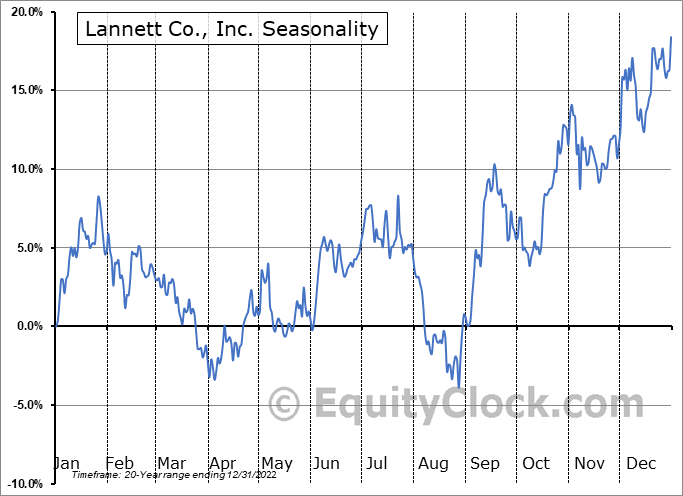
Lannett Co., Inc. (NYSE:LCI) Seasonal Chart

Investor Bancorp Inc. (NASD:ISBC) Seasonal Chart

Bruker Corp. (NASD:BRKR) Seasonal Chart

Chase Corp. (AMEX:CCF) Seasonal Chart

IT Tech Packaging, Inc. (AMEX:ITP) Seasonal Chart

Qurate Retail, Inc. (NASD:QRTEA) Seasonal Chart

Sierra Metals Inc. (AMEX:SMTS) Seasonal Chart

WisdomTree SmallCap Earnings Fund (NYSE:EES) Seasonal Chart

iShares MSCI Spain Capped ETF (NYSE:EWP) Seasonal Chart

SPDR S&P Bank ETF (NYSE:KBE) Seasonal Chart

Invesco S&P SmallCap Industrials ETF (NASD:PSCI) Seasonal Chart

Vanguard Russell 2000 ETF (NASD:VTWO) Seasonal Chart
Â
Â
The Markets
Stocks closed mixed on Thursday as signs of instability in the market continue to emerge. The S&P 500 Index managed to recoup a tenth of one percent following Wednesday’s selloff as investors rotated into safe-havens of staples, health care, technology, utilities, and REITs. Energy, consumer discretionary, financials, industrials, and materials were, by far, the laggards, emphasizing the risk-off nature of the session. The benchmark reached down towards intermediate support at the rising 50-day moving average before finding some buying demand as the dip-buyers attempt to keep the intermediate pace of higher-highs and higher-lows alive. The fact that the market has been unable to make any progress in the upper half of the approximately 200-point trading range between 4350 and 4550 indicates that the momentum in the market has already been struggling. For now, intermediate support at the 50-day continues to be the hurdle to contend with, but any break of this variable barrier to the rising intermediate-term trend or, more importantly, the July low at 4233, would likely lead to a quick washout lower. Of course, volatility and erratic trading are all too common for this time time of year, but this is not reason to be fearful of the market at this time, but rather opportunistic as it can lead to great buying opportunities ahead of the Fall and the best six months of the year for stocks between November and April.

Today, in our Market Outlook to subscribers, we discuss the following:
- Breakout in the US Dollar Index above a double-bottom pattern and the impact on risk assets
- The breakdown of the Energy Sector ETF (XLE) and the minor period of seasonal strength ahead related to the heart of hurricane season
- Weekly Jobless Claims and the health of the labor market
- Natural gas and looking forward to the period of seasonal strength for the commodity
- Manufacturer sentiment as gauged by the Philadelphia Fed Manufacturing Index
Subscribe now and we’ll send this outlook to you.
Sentiment on Thursday as gauged by the put-call ratio, ended bearish at 1.04.

Â
Â
Â
Â
Seasonal charts of companies reporting earnings today:


 Seasonal Chart")
Â
Â
S&P 500 Index


Â
Â
TSE Composite


| Sponsored By... |

|

