Stock Market Outlook for August 5, 2021

Days of supply of oil is curling higher, abnormal for the summer season.
Â
Â
Â
*** Stocks highlighted are for information purposes only and should not be considered as advice to purchase or to sell mentioned securities.  As always, the use of technical and fundamental analysis is encouraged in order to fine tune entry and exit points to average seasonal trends.
Stocks Entering Period of Seasonal Strength Today:
Subscribers – Click on the relevant link to view the full profile. Not a subscriber? Signup here.
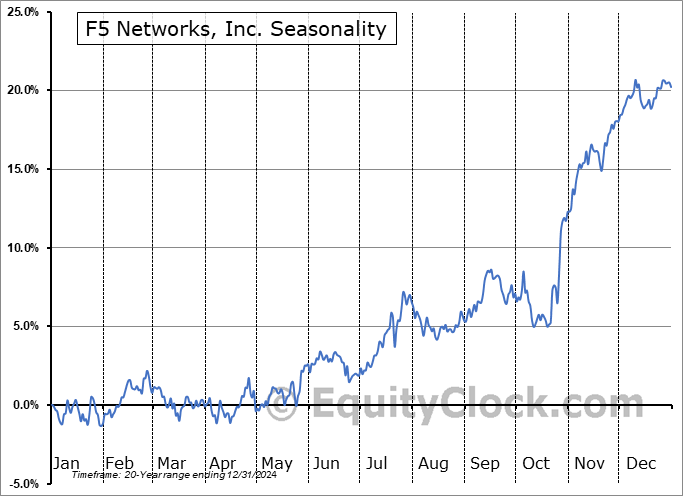
F5 Networks, Inc. (NASD:FFIV) Seasonal Chart

Tyler Technologies, Inc. (NYSE:TYL) Seasonal Chart

Discovery, Inc. (NASD:DISCK) Seasonal Chart

Axis Capital Holdings Ltd. (NYSE:AXS) Seasonal Chart

Bloomin’ Brands Inc. (NASD:BLMN) Seasonal Chart

Hilton Worldwide Holdings Inc. (NYSE:HLT) Seasonal Chart

Vocera Communications, Inc. (NYSE:VCRA) Seasonal Chart
Â
Â
The Markets
Stocks dipped on Wednesday as investors digested weaker than expected data on the economy. The S&P 500 Index ended lower by a third of one percent, continuing to gyrate within the short-term trading range that has been carved out over the past week and a half. Short-term support at the 20-day moving average is immediately below at 4374, while intermediate support remains solid at the rising 50-day moving average around 4300. The benchmark continues to hover around the mid-point to its approximately 200-point trading range that now spans between 4325 and 4525, however, the fact that the benchmark has spent more time in the past few months in the lower half of the rising range speaks to waning upside momentum. This is further reinforced by the decline in momentum indicators, which are negatively diverging from price. These are typically the hallmarks of the periods ahead of broad market pullbacks, something that is typical and normal in any given year.

Today, in our Market Outlook to subscribers, we discuss the following:
- US petroleum status and the price of oil
- The Oil Exploration and Production ETF and the ideal risk/reward buy zone
- NYSE Margin Debt and the state of leverage in the market
Subscribe now and we’ll send this outlook to you.
Sentiment on Wednesday, as gauged by the put-call ratio, ended bullish at 0.84.

Â
Â
Seasonal charts of companies reporting earnings today:


Â
Â
S&P 500 Index


Â
Â
TSE Composite


| Sponsored By... |

|

