Stock Market Outlook for July 30, 2021

The decline in the US Dollar is creating opportunities to buy.
Â
Â
Â
*** Stocks highlighted are for information purposes only and should not be considered as advice to purchase or to sell mentioned securities.  As always, the use of technical and fundamental analysis is encouraged in order to fine tune entry and exit points to average seasonal trends.
Stocks Entering Period of Seasonal Strength Today:
Subscribers – Click on the relevant link to view the full profile. Not a subscriber? Signup here.

Toro Co. (NYSE:TTC) Seasonal Chart

Medallion Financial Corp. (NASD:MFIN) Seasonal Chart

Xylem Inc. (NYSE:XYL) Seasonal Chart

Air Lease Corp. (NYSE:AL) Seasonal Chart

Greene County Bancorp, Inc. (NASD:GCBC) Seasonal Chart

Canadian Banc Recovery Corp. (TSE:BK.TO) Seasonal Chart

WisdomTree Total Earnings Fund (NYSE:EXT) Seasonal Chart
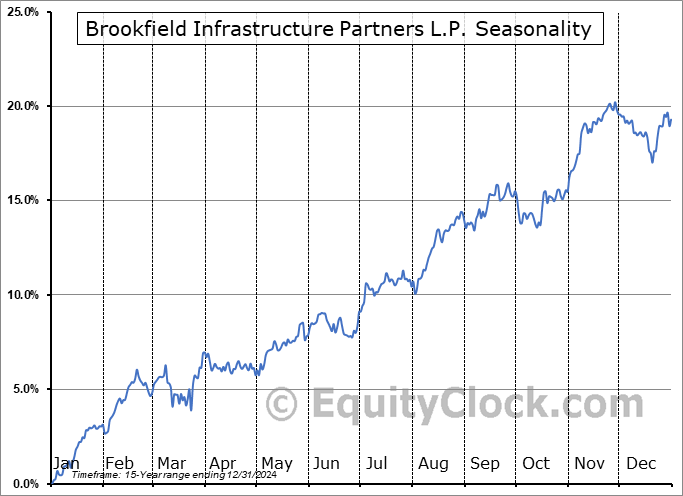
Brookfield Infrastructure Partners L.P. (TSE:BIP/UN.TO) Seasonal Chart

Signet Jewelers Ltd. (NYSE:SIG) Seasonal Chart

Nu Skin Enterprises, Inc. (NYSE:NUS) Seasonal Chart

Selective Insurance Group, Inc. (NASD:SIGI) Seasonal Chart
Â
Â
The Markets
Stocks closed higher on Thursday as the decline in the US Dollar helped to support the broad market. The S&P 500 Index gained just over four-tenths of one percent, bouncing back from levels of short-term support around the rising 20-day moving average. Intermediate support remains solid at the rising 50-day moving average, now at 4278. The limits of the intermediate rising trading range can be seen at 4300 and 4500.

Today, in our Market Outlook to subscribers, we discuss the following:
- The rise in cyclical sectors on Thursday and our thoughts pertaining to this shift back towards risk
- The price of gold
- Alternative bets to defensive sectors through the remainder of the third quarter
- Weekly jobless claims and the health of the labor market
- Natural gas inventories and the fundamental backdrop to the commodity
Subscribe now and we’ll send this outlook to you.
Just released…
Our monthly report for August is out, providing everything that you need to know for the month(s) ahead.Â
Highlights in this report include:
- Equity market tendencies in the month of August
- Favor bonds or stocks?
- REITs
- From a positive trend for stocks to one that is range-bound
- Normal instability for this point in the market cycle
- The abnormal uptick in respiratory illnesses for this time of year
- From 14-year lows to multi-month highs, credit conditions are changing course
- The shift towards risk aversion
- Time to be constructive in the builders?
- Continued strains resulting from supply chain disruptions
- The inventory issue
- Industrial production has normalized, but manufacturer sentiment remains strong
- Deterioration of breadth
- The negative reactions to declining 50-day moving averages
- Break of trend for the TSX
- The technical status of the S&P 500 Index
- Positioning for the months ahead
- Sector reviews and ratings
- Stocks that have frequently gained in the month of August
- Notable stocks and ETFs entering their period of strength in August
Look for this report in your inbox.
Not subscribed yet? Signup now and we’ll send this report to you.
Sentiment on Thursday, as gauged by the put-call ratio, ended overly bullish at 0.67. The extreme shift from neutral yesterday to overly bullish today certainly raises eyebrows as complacency is implied.

Â
Â
Seasonal charts of companies reporting earnings today:
 Seasonal Chart")


Â
Â
S&P 500 Index


Â
Â
TSE Composite


| Sponsored By... |

|

