Stock Market Outlook for July 29, 2021

US Dollar Index turning lower from resistance, which bodes well for the seasonal trade in Gold at this time of year.
Â
Â
Â
*** Stocks highlighted are for information purposes only and should not be considered as advice to purchase or to sell mentioned securities.  As always, the use of technical and fundamental analysis is encouraged in order to fine tune entry and exit points to average seasonal trends.
Stocks Entering Period of Seasonal Strength Today:
Subscribers – Click on the relevant link to view the full profile. Not a subscriber? Signup here.
Xcel Energy (NASD:XEL) Seasonal Chart
Old National Bancorp (NASD:ONB) Seasonal Chart
Cimpress NV (NASD:CMPR) Seasonal Chart
Donegal Group, Inc. (NASD:DGICA) Seasonal Chart
RBC Quant Canadian Dividend Leaders ETF (TSE:RCD.TO) Seasonal Chart
HomeTrust Bancshares, Inc. (NASD:HTBI) Seasonal Chart
Acceleron Pharma Inc. (NASD:XLRN) Seasonal Chart
Allied Capital Corp. (NYSE:AFC) Seasonal Chart
iShares Morningstar Large-Cap ETF (NYSE:JKD) Seasonal Chart
Invesco S&P SmallCap Low Volatility ETF (AMEX:XSLV) Seasonal Chart
Â
Â
The Markets
Stocks closed mixed on Wednesday as investors digested comments from Fed Chair Jerome Powell. The S&P 500 Index ended in the red by a mere two basis points (0.02%) as weakness in defensive sectors (staples, utilities, and REITs) offset gains in energy and communication services. Short-term support has been tested around the rising 20-day moving average, while intermediate support remains firm at the rising 50-day moving average. The limits of the rising intermediate trend channel can be seen at 4300 and 4500. Earnings continue to be the driver of equity market performance, but, following this reporting period, market volatility is the norm, something that we’ve already seen hints of in recent weeks.
Today, in our Market Outlook to subscribers, we discuss the following:
- US petroleum inventories and the path of demand
- The price of oil
- US International Trade
- Canada Consumer Price Index (CPI)
- The Canadian and US Dollars
- Gold Miners
Subscribe now and we’ll send this outlook to you.
Sentiment on Wednesday, as gauged by the put-call ratio, ended bullish at 0.80.
Â
Â
Â
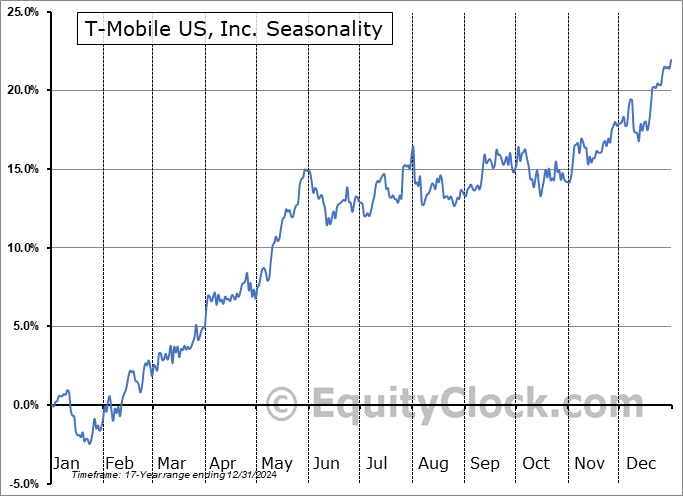
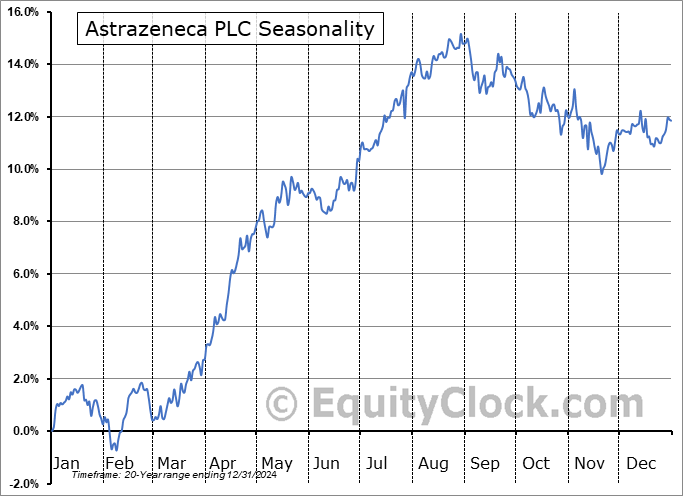
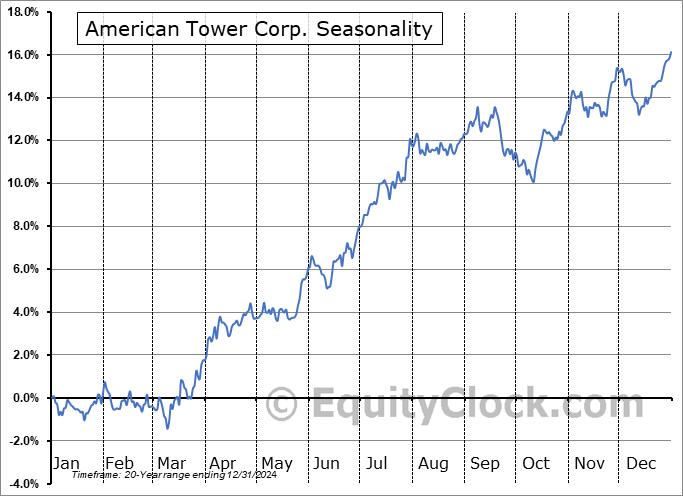
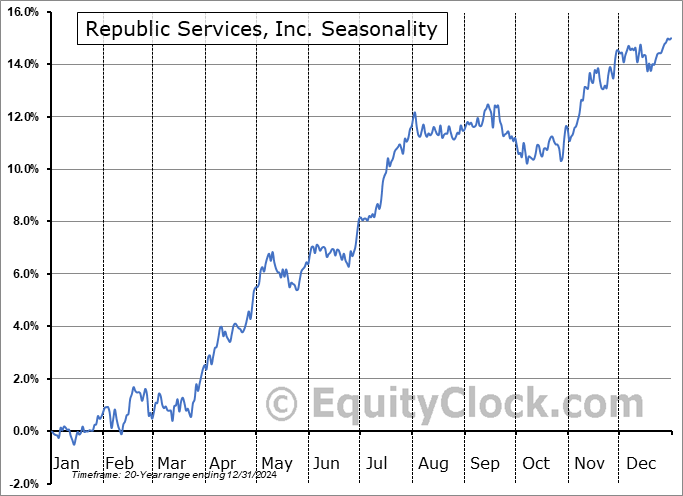
Seasonal charts of companies reporting earnings today:
Â
Â
S&P 500 Index
Â
Â
TSE Composite
| Sponsored By... |

|


