Contact | RSS Feed

Stock Market Outlook for July 28, 2021


The year-to-date change of home prices in the US remains record setting, which bodes well for the economy longer-term.


Real Time Economic Calendar provided by Investing.com.


*** Stocks highlighted are for information purposes only and should not be considered as advice to purchase or to sell mentioned securities.   As always, the use of technical and fundamental analysis is encouraged in order to fine tune entry and exit points to average seasonal trends.

Stocks Entering Period of Seasonal Strength Today:

Subscribers – Click on the relevant link to view the full profile. Not a subscriber? Signup here.

Berkshire Hathaway, Inc. (NYSE:BRK/A) Seasonal Chart

Berkshire Hathaway, Inc. (NYSE:BRK/A) Seasonal Chart

Accenture Ltd. (NYSE:ACN) Seasonal Chart

Accenture Ltd. (NYSE:ACN) Seasonal Chart

CBOE Global Markets Inc. (AMEX:CBOE) Seasonal Chart

CBOE Global Markets Inc. (AMEX:CBOE) Seasonal Chart

Choice Hotels Intl, Inc. (NYSE:CHH) Seasonal Chart

Choice Hotels Intl, Inc. (NYSE:CHH) Seasonal Chart

Purpose Core Dividend Fund (TSE:PDF.TO) Seasonal Chart

Purpose Core Dividend Fund (TSE:PDF.TO) Seasonal Chart

Flushing Financial Corp. (NASD:FFIC) Seasonal Chart

Flushing Financial Corp. (NASD:FFIC) Seasonal Chart

Loral Space & Communications, Inc. (NASD:LORL) Seasonal Chart

Loral Space & Communications, Inc. (NASD:LORL) Seasonal Chart

Telus Corp. (NYSE:TU) Seasonal Chart

Telus Corp. (NYSE:TU) Seasonal Chart

BMO Monthly Income ETF (TSE:ZMI.TO) Seasonal Chart

BMO Monthly Income ETF (TSE:ZMI.TO) Seasonal Chart

Invesco S&P SmallCap 600 Pure Value ETF (NYSE:RZV) Seasonal Chart

Invesco S&P SmallCap 600 Pure Value ETF (NYSE:RZV) Seasonal Chart


The Markets

Stocks slipped on Tuesday following another day of steep declines for Asian equities.  The S&P 500 Index shed just less than half of one percent, weighed down by the high momentum technology names that had carried the benchmark in recent weeks.  The benchmark reached back to test levels around its rising 20-day moving average, pegging the short-term hurdle as a level of short-term support.  The benchmark is back to the mid-point to its rising 200-point trading range that hovers between 4300 and 4500.

image

Today, in our Market Outlook to subscribers, we discuss the following:

  • A look at the short-term trend of the S&P 500 Index: Did Tuesday’s drawdown cause any damage?
  • Major benchmarks back to levels of horizontal resistance
  • The plunge in the Hong Kong Hang Seng and the target that one particular technical setup suggests
  • US Durable Goods Orders and the health of the manufacturing economy
  • US Home Prices

Subscribe now and we’ll send this outlook to you.

Sentiment on Tuesday, as gauged by the put-call ratio, ended neutral at 1.00.

image


Seasonal charts of companies reporting earnings today:

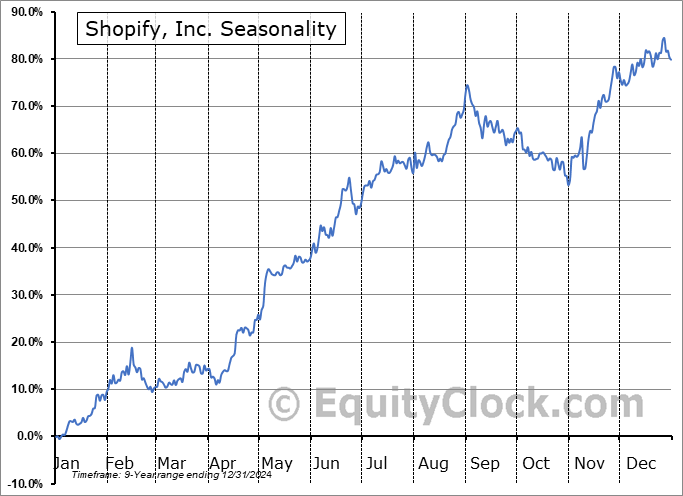
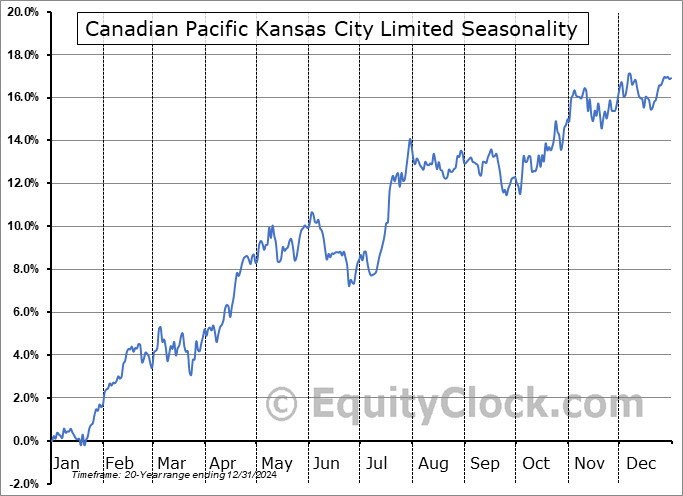
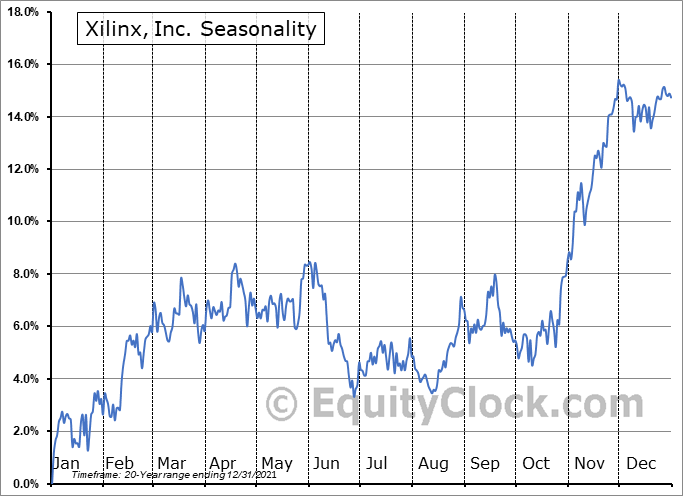
Facebook, Inc. Seasonal Chart PayPal Holdings, Inc. Seasonal Chart Pfizer, Inc. Seasonal Chart Thermo Fisher Scientific Inc Seasonal Chart Shopify Inc. Seasonal Chart McDonald's Corporation Seasonal Chart QUALCOMM Incorporated Seasonal Chart Bristol-Myers Squibb Company Seasonal Chart Boeing Company (The) Seasonal Chart ServiceNow, Inc. Seasonal Chart GlaxoSmithKline PLC Seasonal Chart Lam Research Corporation Seasonal Chart Automatic Data Processing, Inc. Seasonal Chart CME Group Inc. Seasonal Chart Equinix, Inc. Seasonal Chart Moody's Corporation Seasonal Chart Norfolk Southern Corporation Seasonal Chart Equinor ASA Seasonal Chart Humana Inc. Seasonal Chart Ford Motor Company Seasonal Chart General Dynamics Corporation Seasonal Chart Enterprise Products Partners L.P. Seasonal Chart Align Technology, Inc. Seasonal Chart Canadian Pacific Railway Limited Seasonal Chart TE Connectivity Ltd. Seasonal Chart O'Reilly Automotive, Inc. Seasonal Chart Amphenol Corporation Seasonal Chart Barclays PLC Seasonal Chart Cognizant Technology Solutions Corporation Seasonal Chart Aflac Incorporated Seasonal Chart Xilinx, Inc. Seasonal Chart Suncor Energy Inc. Seasonal Chart AvalonBay Communities, Inc. Seasonal Chart Old Dominion Freight Line, Inc. Seasonal Chart Fomento Economico Mexicano S.A.B. de C.V. Seasonal Chart Garmin Ltd. Seasonal Chart Generac Holdlings Inc. Seasonal Chart Canon, Inc. Seasonal Chart Yandex N.V. Seasonal Chart United Rentals, Inc. Seasonal Chart United Microelectronics Corporation Seasonal Chart Hess Corporation Seasonal Chart CGI Inc. Seasonal Chart Hartford Financial Services Group, Inc. (The) Seasonal Chart Mid-America Apartment Communities, Inc. Seasonal Chart Teledyne Technologies Incorporated Seasonal Chart


S&P 500 Index

image

image


TSE Composite

image

image


Sponsored By...
Seasonal Advantage Portfolio by CastleMoore

Comments are closed.