Stock Market Outlook for July 27, 2021

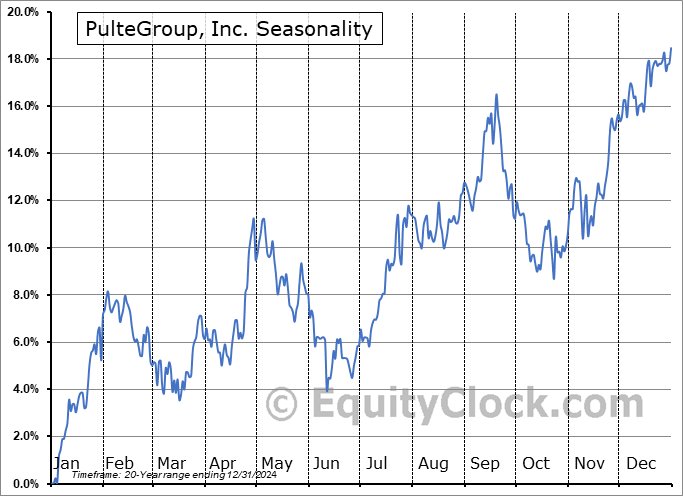
A shocking report on new home sales in the US pours cold water on the fundamental prospects for the home construction industry.
Â
Â
Â
*** Stocks highlighted are for information purposes only and should not be considered as advice to purchase or to sell mentioned securities.  As always, the use of technical and fundamental analysis is encouraged in order to fine tune entry and exit points to average seasonal trends.
Stocks Entering Period of Seasonal Strength Today:
Subscribers – Click on the relevant link to view the full profile. Not a subscriber? Signup here.
Humana, Inc. (NYSE:HUM) Seasonal Chart
Parkland Fuel Corp. (TSE:PKI.TO) Seasonal Chart
TELUS Corp. (TSE:T.TO) Seasonal Chart
C.H. Robinson Worldwide, Inc. (NASD:CHRW) Seasonal Chart
ProShares Hedge Replication ETF (NYSE:HDG) Seasonal Chart
Crown Castle Intl Corp. (NYSE:CCI) Seasonal Chart
Insight Enterprises, Inc. (NASD:NSIT) Seasonal Chart
Carriage Services, Inc. (NYSE:CSV) Seasonal Chart
Pacific Biosciences of California Inc. (NASD:PACB) Seasonal Chart
General Finance Corp. (NASD:GFN) Seasonal Chart
Norwegian Cruise Line Holdings Ltd. (NYSE:NCLH) Seasonal Chart
Morguard North American Residential REIT (TSE:MRG/UN.TO) Seasonal Chart
Invesco Canadian Dividend Index ETF (TSE:PDC.TO) Seasonal Chart
Vanguard FTSE Canadian High Dividend Yield Index ETF (TSE:VDY.TO) Seasonal Chart
BMO Ultra Short-Term Bond ETF (TSE:ZST.TO) Seasonal Chart
SPDR S&P Transportation ETF (NYSE:XTN) Seasonal Chart
Â
Â
The Markets
Stocks rose in the Monday session as investors continue to focus on earnings, which have been coming in better than forecast. The S&P 500 Index added just less than a quarter of one percent, lifted by stocks in the energy and consumer discretionary sector. The large-cap benchmark remains supported by its rising 50-day moving average and is pushing past psychological resistance at 4400. The limits of the rising trend channel are now pegged around 4300 and 4500. Momentum indicators have rebounded and MACD has triggered a renewed buy signal as investors bid stocks higher into some key reports and ahead of the FOMC announcement midweek.
Want to know which areas of the market to buy or sell? Our Weekly Chart Books have just been updated, providing a clear Accumulate, Avoid, or Neutral rating for currencies, cryptocurrencies, commodities, broad markets, and subsectors/industries of the market. Subscribers can login and click on the relevant links to access.
Subscribe now.
Â
Today, in our Market Outlook to subscribers, we discuss the following:
- Notable changes in this week’s chart books: find out what has been added to our list of areas to Accumulate
- The price of copper
- US New Home Sales and the stocks of the home builders
Subscribe now and we’ll send this outlook to you.
Sentiment on Monday, as gauged by the put-call ratio, ended bullish at 0.87.
Â
Â
Seasonal charts of companies reporting earnings today:
Â
Â
S&P 500 Index
Â
Â
TSE Composite
| Sponsored By... |

|


