Stock Market Outlook for July 19, 2021

Now that the summer rally period is over, we hunker down for the period of volatility that is average through the remainder of the third quarter.
Â
Â
*** Stocks highlighted are for information purposes only and should not be considered as advice to purchase or to sell mentioned securities.  As always, the use of technical and fundamental analysis is encouraged in order to fine tune entry and exit points to average seasonal trends.
Stocks Entering Period of Seasonal Strength Today:
Subscribers – Click on the relevant link to view the full profile. Not a subscriber? Signup here.

Fortis, Inc. (TSE:FTS.TO) Seasonal Chart

Broadridge Financial Solutions, LLC (NYSE:BR) Seasonal Chart

IPG Photonics Corp. (NASD:IPGP) Seasonal Chart
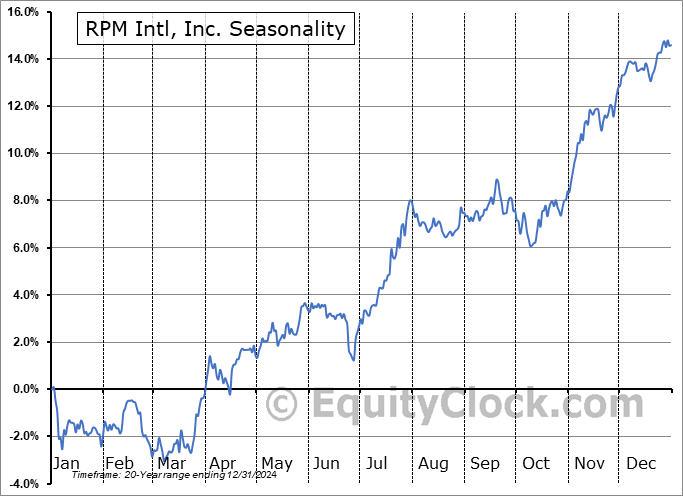
RPM Intl, Inc. (NYSE:RPM) Seasonal Chart

Atrium Mortgage Investment Corp. (TSE:AI.TO) Seasonal Chart

VanEck Vectors Investment Grade Floating Rate ETF (NYSE:FLTR) Seasonal Chart

Carnival Plc. (NYSE:CUK) Seasonal Chart

Invesco DB Precious Metals Fund (NYSE:DBP) Seasonal Chart

ProShares UltraPro Short Russell2000 (NYSE:SRTY) Seasonal Chart
Â
Â
The Markets
Stocks drifted lower on Friday as investors increasingly become risk averse, selling down pro-cyclical sectors of the market in favor of defensives. The S&P 500 Index fell by three-quarters of one percent, reaching back towards levels around rising short-term support at the 20-day average. Momentum indicators continue to roll over with MACD triggering a new sell signal as the technical indicator crosses below its signal line. The limits of the rising intermediate trend channel can now be seen around 4275 and 4475. Barring some catalyst to the contrary, all indications point to the start of the period of volatility for stocks, an average tendency that spans the remainder of the third quarter.

Today, in our Market Outlook to subscribers, we discuss the following:
- Risk aversion in the equity market and the typical trading pattern of stocks through the end of the third quarter
- Weekly look at the S&P 500 Index
- US Retail Sales and what is acting as a burden on the headline print
- The shortfall of retailer inventories
Subscribe now and we’ll send this outlook to you.
Sentiment on Friday, as gauged by the put-call ratio, ended neutral at 0.98.

Â
Seasonal charts of companies reporting earnings today:


Â
Â
S&P 500 Index


Â
TSE Composite


| Sponsored By... |

|

